
📺 Lecture video | 📄 Slides
Week 2, Lecture 3: Scale Space, Image Pyramids and Filter Banks#
NPTEL Deep Learning for Computer Vision | Prof. Vineeth N Balasubramanian, IIT Hyderabad
Companion notebook for §2.3 Scale Space, Image Pyramids and Filter Banks.
What you will learn
Select a characteristic scale automatically from the scale signature.
Build Gaussian and Laplacian pyramids, and use them for coarse-to-fine registration.
See why a histogram alone cannot describe texture.
Build Gabor filters and filter banks, and understand what makes a filter steerable.
Contents
Automatic scale selection: the scale signature
The Gaussian pyramid
The Laplacian pyramid
Coarse-to-fine registration
Texture: why a histogram is not enough
Gabor filters
Filter banks
Steerable filters
How to run Runs on Colab or a local Jupyter, CPU only. Every image is bundled with scikit-image, so nothing is downloaded. Run the setup cell first, then go top to bottom.
Review#
The previous lecture detected corners with the Harris operator over a fixed window. A corner seen through a small window can look like an edge through a large one, so the Harris response is not scale invariant.
This lecture builds the machinery for handling scale directly:
choosing a characteristic scale for a structure (automatic scale selection),
the Gaussian and Laplacian pyramids that make multi-scale processing cheap,
texture description with filter banks, including Gabor and steerable filters.
Setup#
Everything uses images bundled with scikit-image or generated synthetically, so the notebook runs offline. Two helpers are shared across sections.
%matplotlib inline
import numpy as np
import matplotlib.pyplot as plt
from scipy import ndimage as ndi
from skimage import data, util, color

np.random.seed(0)
plt.rcParams['figure.figsize'] = (10, 4)
plt.rcParams['image.cmap']     = 'gray'
plt.rcParams['figure.dpi']     = 85

def load_gray(image):
    return color.rgb2gray(image) if image.ndim == 3 else util.img_as_float(image)

def show(ax, im, title='', cmap='gray'):
    ax.imshow(im, cmap=cmap); ax.set_title(title); ax.axis("off")
1. Automatic scale selection: the scale signature#
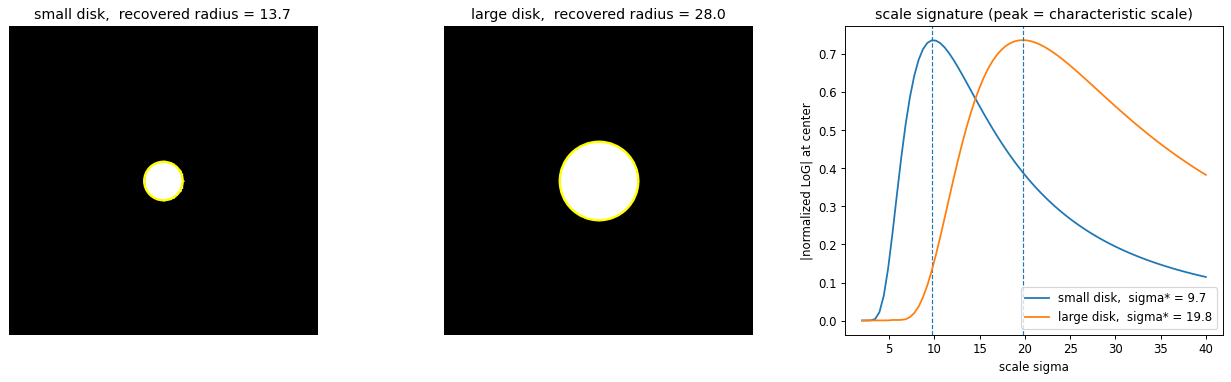
To match interest points across images taken at different zoom, each point needs a characteristic scale that the detector picks the same way in every image.
The recipe is to evaluate a scale-dependent function at a point over a range of scales and read off the scale where it peaks. A good choice is the scale-normalized Laplacian of Gaussian
The \(\sigma^2\) factor cancels the natural decay of derivative amplitude with scale, so responses are comparable across scales. For a bright disk of radius \(r\) the response magnitude peaks at
Plotting the response against \(\sigma\) at a fixed point gives a scale signature, and its peak is the characteristic scale. Doubling the structure size doubles \(\sigma^\star\), which is what makes the scale comparable across images.
def disk(n, cx, cy, r):
    yy, xx = np.mgrid[0:n, 0:n]
    return ((xx - cx)**2 + (yy - cy)**2 <= r**2).astype(float)

def norm_log(im, sigma):                       # scale-normalized LoG
    return sigma**2 * ndi.gaussian_laplace(im, sigma)

def signature(im, sigmas, p):                  # |normalized LoG| at point p over scales
    return np.array([abs(norm_log(im, s)[p]) for s in sigmas])

n = 220
small, big = disk(n, n//2, n//2, 14), disk(n, n//2, n//2, 28)
sigmas = np.linspace(2, 40, 80)
p = (n//2, n//2)

fig, ax = plt.subplots(1, 3, figsize=(15, 4.6))
for a, im, name in [(ax[0], small, 'small disk'), (ax[1], big, 'large disk')]:
    sg = signature(im, sigmas, p)
    s_star = sigmas[sg.argmax()]
    show(a, im, f'{name},  recovered radius = {s_star * np.sqrt(2):.1f}')
    a.add_patch(plt.Circle(p[::-1], s_star * np.sqrt(2), color='yellow', fill=False, lw=2))
    ax[2].plot(sigmas, sg, label=f'{name},  sigma* = {s_star:.1f}')
    ax[2].axvline(s_star, ls='--', lw=1)
ax[2].set_xlabel('scale sigma'); ax[2].set_ylabel('|normalized LoG| at center')
ax[2].set_title('scale signature (peak = characteristic scale)'); ax[2].legend()
plt.tight_layout(); plt.show()
2. The Gaussian pyramid#
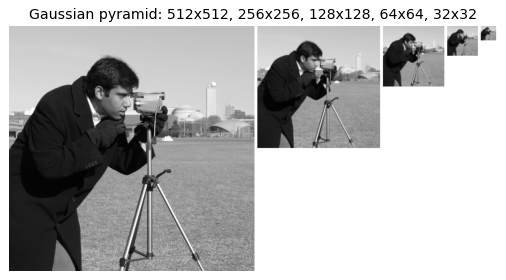
Evaluating a function at many scales by enlarging the window is wasteful. The equivalent and cheaper route fixes the window and shrinks the image. Repeatedly smoothing and downsampling by two builds a Gaussian pyramid
where \(\downarrow_2\) keeps every second pixel. Smoothing before subsampling is essential: it removes frequencies above the new Nyquist limit and prevents aliasing. Each level has half the resolution of the one below, so the whole pyramid costs only about \(\tfrac{4}{3}\) the pixels of the original.
def gaussian_pyramid(im, levels, sigma=1.0):
    pyr = [im]
    for _ in range(levels - 1):
        pyr.append(ndi.gaussian_filter(pyr[-1], sigma)[::2, ::2])
    return pyr

def montage(levels, pad=6):                    # place levels side by side at true size
    H = levels[0].shape[0]
    W = sum(p.shape[1] for p in levels) + pad * len(levels)
    canvas = np.ones((H, W))
    x = 0
    for p in levels:
        h, w = p.shape
        canvas[:h, x:x + w] = p
        x += w + pad
    return canvas

img = load_gray(data.camera())[:512, :512]
gp = gaussian_pyramid(img, 5)

fig, ax = plt.subplots(figsize=(13, 3.4))
show(ax, montage(gp), 'Gaussian pyramid: ' + ', '.join(f'{p.shape[0]}x{p.shape[1]}' for p in gp))
plt.tight_layout(); plt.show()
3. The Laplacian pyramid#
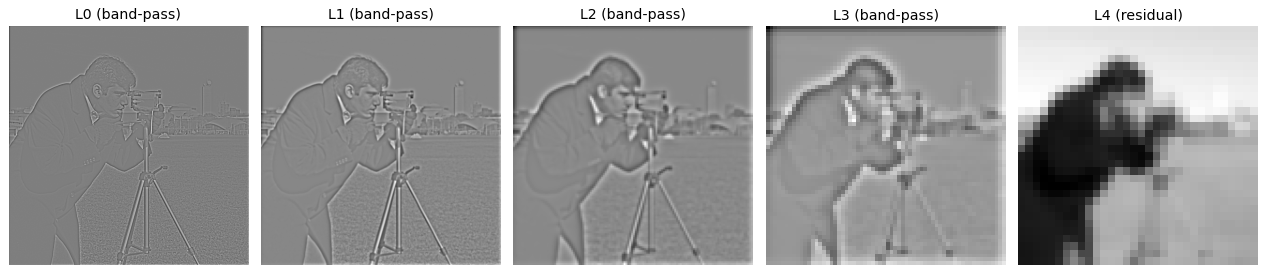
Each Gaussian level discards the detail removed by smoothing. The Laplacian pyramid stores that lost detail as the difference between a level and a blurred, upsampled copy of the next coarser level
Here \(\mathrm{expand}\) upsamples by inserting zeros and smoothing. Each \(L_k\) is a band-pass image: it holds the frequencies present at level \(k\) but absent at level \(k+1\).
The representation is invertible. Using the same expand operator,
telescopes back to the original image exactly, which is why Laplacian pyramids are used for blending and compression.
def expand(small, out_shape, sigma=1.4):       # zero-insert upsample then smooth
    up = np.zeros(out_shape)
    up[::2, ::2] = small[:(out_shape[0] + 1)//2, :(out_shape[1] + 1)//2]
    return ndi.gaussian_filter(up, sigma) * 4.0

def laplacian_pyramid(im, levels, sigma=1.0):
    g = gaussian_pyramid(im, levels, sigma)
    lap = [g[k] - expand(g[k + 1], g[k].shape) for k in range(levels - 1)]
    lap.append(g[-1])                          # coarsest level kept as the residual
    return lap

def reconstruct(lap):
    img = lap[-1]
    for k in range(len(lap) - 2, -1, -1):
        img = lap[k] + expand(img, lap[k].shape)
    return img

lp  = laplacian_pyramid(img, 5)
rec = reconstruct(lp)

fig, ax = plt.subplots(1, 5, figsize=(15, 3.4))
for k in range(4):
    show(ax[k], lp[k], f'L{k} (band-pass)')
show(ax[4], lp[4], 'L4 (residual)')
plt.tight_layout(); plt.show()

print('reconstruction max abs error:', np.abs(rec - img).max())
reconstruction max abs error: 1.1102230246251565e-16
4. Coarse-to-fine registration#
Aligning two images by searching all displacements at full resolution is expensive. The pyramid turns it into a small search at each scale.
Algorithm:
Build a Gaussian pyramid of both images.
Estimate the displacement at the coarsest level with a small search.
Double the estimate and pass it to the next finer level.
Refine there with a tiny search of a pixel or two.
Repeat down to full resolution.
A displacement of \(d\) pixels at full resolution is only \(d / 2^{N-1}\) at the coarsest level, so a small window there already covers it. Each finer level corrects the estimate locally, so the search range stays tiny throughout.
def ssd(a, b):
    return np.mean((a - b)**2)

def search_shift(ref, mov, center, radius, margin=6):
    H, W = ref.shape; cy, cx = center
    best, best_s = np.inf, center
    for dy in range(cy - radius, cy + radius + 1):
        for dx in range(cx - radius, cx + radius + 1):
            s = ndi.shift(mov, (-dy, -dx), order=1, mode='reflect')
            e = ssd(ref[margin:H - margin, margin:W - margin],
                    s[margin:H - margin, margin:W - margin])
            if e < best:
                best, best_s = e, (dy, dx)
    return best_s

ref = load_gray(data.camera())[:512, :512]
true_shift = (13.0, -9.0)
mov = ndi.shift(ref, true_shift, order=3, mode='reflect')

levels = 4
rp, mp = gaussian_pyramid(ref, levels), gaussian_pyramid(mov, levels)
est, evaluated = (0, 0), 0
for lvl in reversed(range(levels)):
    if lvl == levels - 1:
        radius, center = 5, (0, 0)            # wider search on the tiny coarse image
    else:
        est = (est[0] * 2, est[1] * 2)        # propagate estimate to the finer level
        radius, center = 1, est
    est = search_shift(rp[lvl], mp[lvl], center, radius)
    evaluated += (2 * radius + 1)**2

aligned = ndi.shift(mov, (-est[0], -est[1]), order=1, mode='reflect')
fig, ax = plt.subplots(1, 3, figsize=(14, 4.4))
show(ax[0], ref, 'reference')
show(ax[1], mov, f'shifted by {true_shift}')
show(ax[2], np.abs(ref - aligned), f'residual after alignment\nrecovered = {est}', cmap='magma')
plt.tight_layout(); plt.show()

max_disp = 16
print(f'true shift {true_shift}, recovered {est}')
print(f'candidates evaluated coarse-to-fine: {evaluated}   '
      f'vs single-level brute force +-{max_disp}: {(2 * max_disp + 1)**2}')
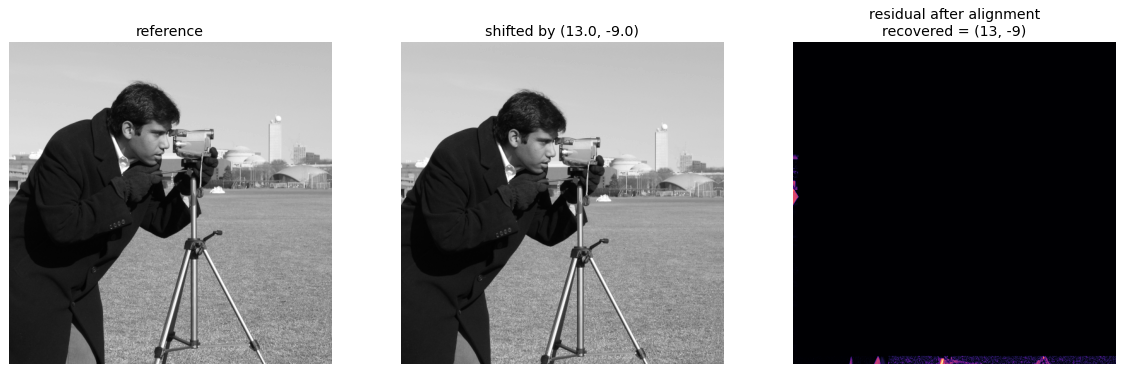
true shift (13.0, -9.0), recovered (13, -9)
candidates evaluated coarse-to-fine: 148   vs single-level brute force +-16: 1089
5. Texture: why a histogram is not enough#
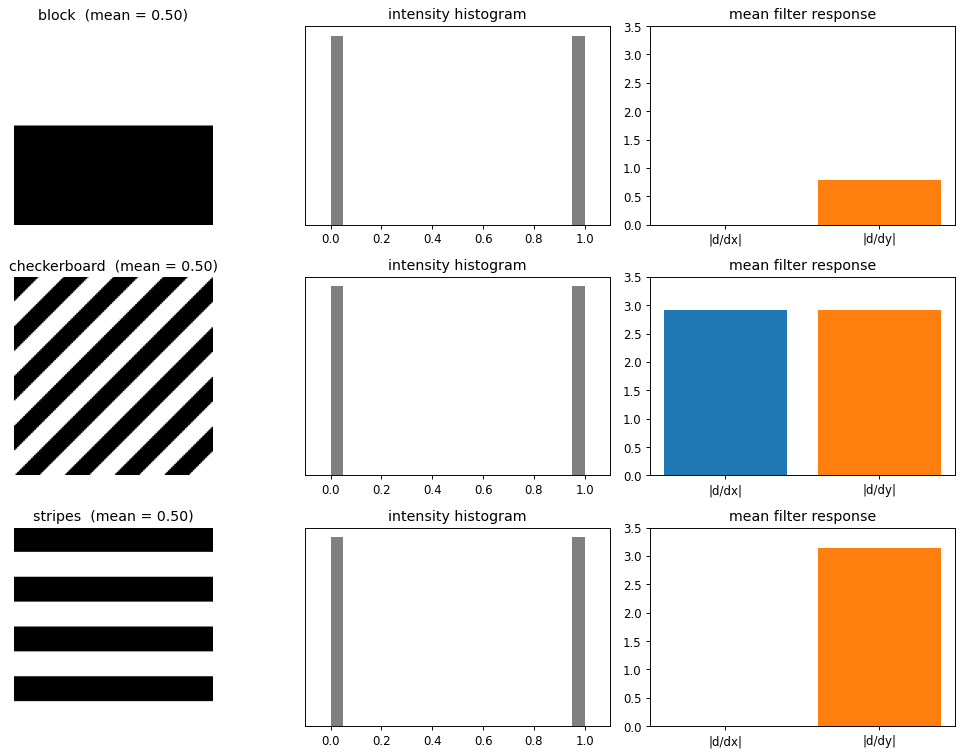
Texture is the spatial arrangement of intensities, not just their distribution. Three patterns can share an identical intensity histogram yet look completely different: a block, a checkerboard, and stripes are each half black and half white.
A histogram ignores spatial layout, so it cannot tell them apart. What separates them is how they respond to oriented filters. The derivative-of-Gaussian filters \(\partial_x g\) and \(\partial_y g\) respond to vertical and horizontal edges respectively, and the mean absolute response already forms a small feature that pulls the three patterns apart. Richer texture descriptors extend this to many orientations and scales.
def block(n):      im = np.zeros((n, n)); im[:n//2] = 1; return im
def checker(n, k): return ((np.indices((n, n)).sum(0)//k) % 2).astype(float)
def stripes(n, k): col = (np.arange(n)//k) % 2; return np.repeat(col[:, None], n, 1).astype(float)

def dog(size, sigma, axis):                    # derivative of Gaussian
    r = size//2; y, x = np.mgrid[-r:r + 1, -r:r + 1]
    g = np.exp(-(x**2 + y**2)/(2*sigma**2))
    return (-x/sigma**2*g) if axis == 'x' else (-y/sigma**2*g)

n = 128
patterns = {'block': block(n), 'checkerboard': checker(n, 16), 'stripes': stripes(n, 16)}
fx, fy = dog(15, 3, 'x'), dog(15, 3, 'y')

fig, ax = plt.subplots(3, 3, figsize=(12, 9))
for i, (name, im) in enumerate(patterns.items()):
    rx = np.abs(ndi.convolve(im, fx, mode='wrap')).mean()
    ry = np.abs(ndi.convolve(im, fy, mode='wrap')).mean()
    show(ax[i, 0], im, f'{name}  (mean = {im.mean():.2f})')
    ax[i, 1].hist(im.ravel(), bins=20, color='gray')
    ax[i, 1].set_title('intensity histogram'); ax[i, 1].set_xlim(-0.1, 1.1); ax[i, 1].set_yticks([])
    ax[i, 2].bar(['|d/dx|', '|d/dy|'], [rx, ry], color=['tab:blue', 'tab:orange'])
    ax[i, 2].set_ylim(0, 3.5); ax[i, 2].set_title('mean filter response')
plt.tight_layout(); plt.show()
6. Gabor filters#
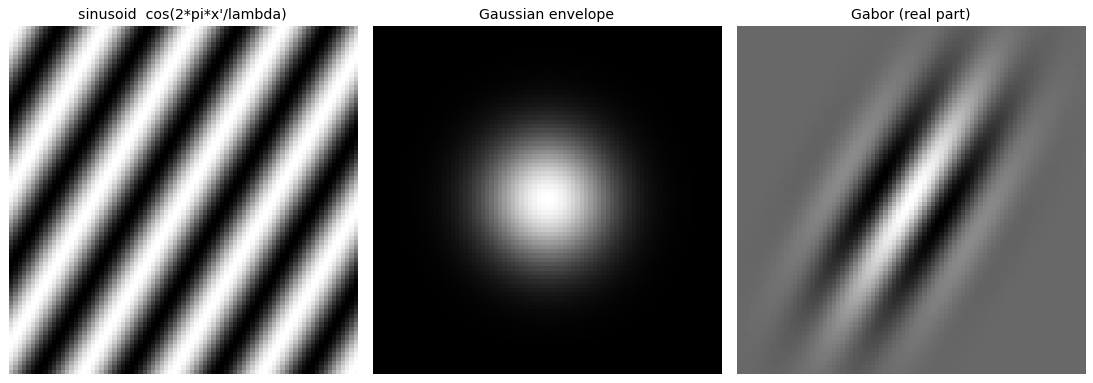
A Gabor filter is a sinusoid of a chosen frequency and orientation multiplied by a Gaussian envelope. It responds to a narrow band of frequencies at a particular orientation, which makes it a natural texture and edge detector. The complex form is
with the coordinates rotated by the orientation \(\theta\):
The parameters are
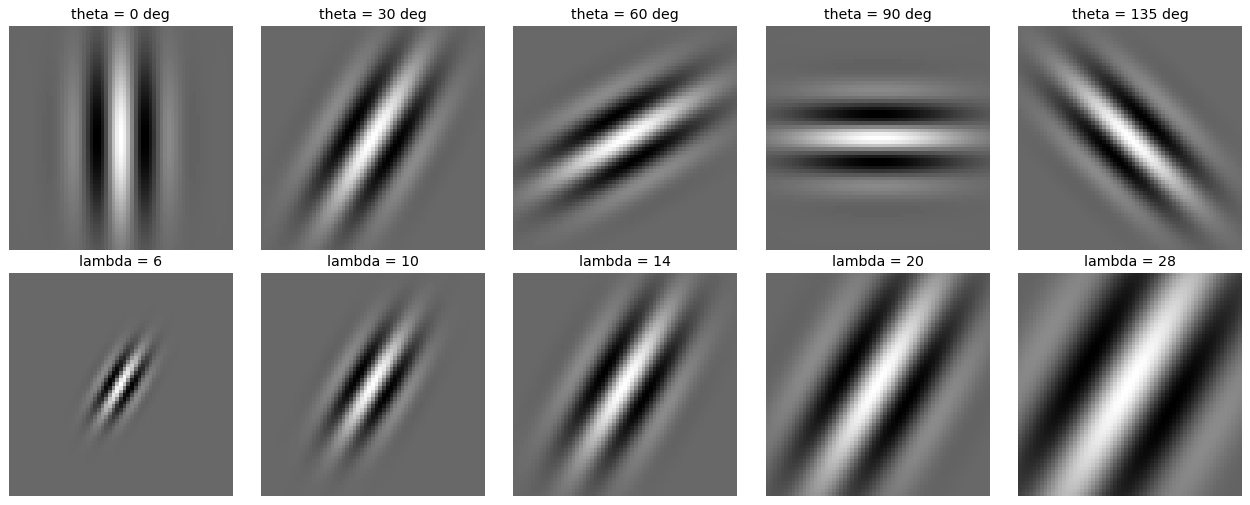
\(\theta\): orientation of the stripes,
\(\lambda\): wavelength of the sinusoid,
\(\psi\): phase offset,
\(\sigma\): width of the Gaussian envelope,
\(\gamma\): aspect ratio of the envelope.
The real part is an even (cosine) filter and the imaginary part is an odd (sine) filter.
def gabor(size, lam, theta, psi=0.0, sigma=None, gamma=0.5):
    if sigma is None: sigma = 0.56 * lam       # envelope width for ~1 octave bandwidth
    r = size//2; y, x = np.mgrid[-r:r + 1, -r:r + 1]
    xr =  x*np.cos(theta) + y*np.sin(theta)
    yr = -x*np.sin(theta) + y*np.cos(theta)
    envelope = np.exp(-(xr**2 + gamma**2 * yr**2)/(2*sigma**2))
    carrier  = np.exp(1j*(2*np.pi*xr/lam + psi))
    return envelope * carrier

# sinusoid x Gaussian = Gabor
size, lam, theta = 81, 18, np.deg2rad(30)
r = size//2; y, x = np.mgrid[-r:r + 1, -r:r + 1]
xr = x*np.cos(theta) + y*np.sin(theta)
sinusoid = np.cos(2*np.pi*xr/lam)
envelope = np.exp(-(x**2 + y**2)/(2*(0.56*lam)**2))

fig, ax = plt.subplots(1, 3, figsize=(13, 4.4))
show(ax[0], sinusoid, "sinusoid  cos(2*pi*x'/lambda)")
show(ax[1], envelope, 'Gaussian envelope')
show(ax[2], gabor(size, lam, theta).real, 'Gabor (real part)')
plt.tight_layout(); plt.show()
# effect of orientation (top) and wavelength (bottom)
fig, ax = plt.subplots(2, 5, figsize=(15, 6))
for j, deg in enumerate([0, 30, 60, 90, 135]):
    show(ax[0, j], gabor(61, 14, np.deg2rad(deg)).real, f'theta = {deg} deg')
for j, lam in enumerate([6, 10, 14, 20, 28]):
    show(ax[1, j], gabor(61, lam, np.deg2rad(30)).real, f'lambda = {lam}')
plt.tight_layout(); plt.show()
7. Filter banks#
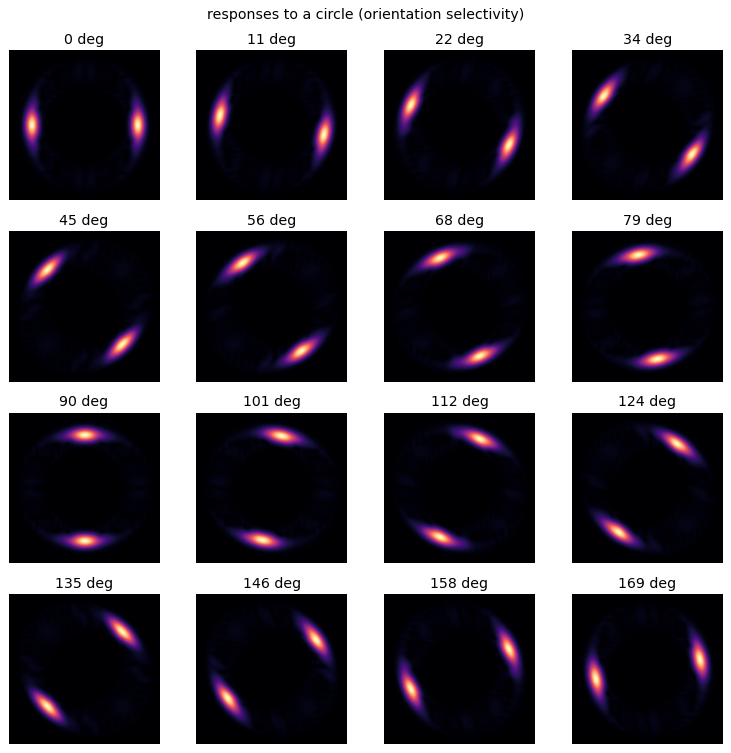
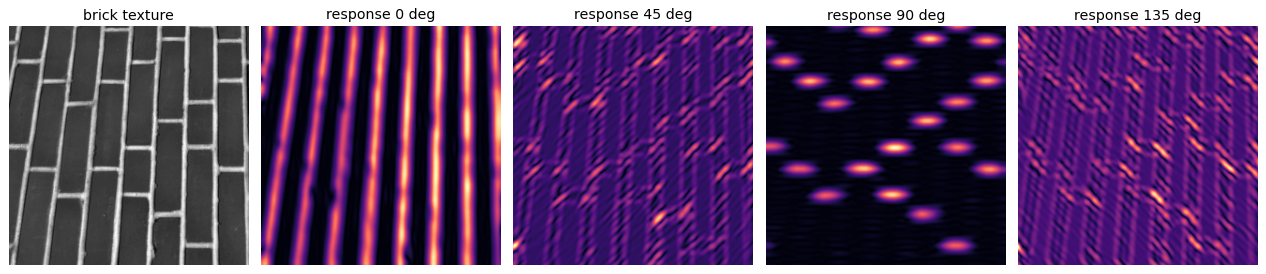
A filter bank is a collection of band-pass filters tuned to different orientations and scales. Running an image through the bank and keeping the responses (or their magnitudes) describes the local structure: which orientations and frequencies are present at each location.
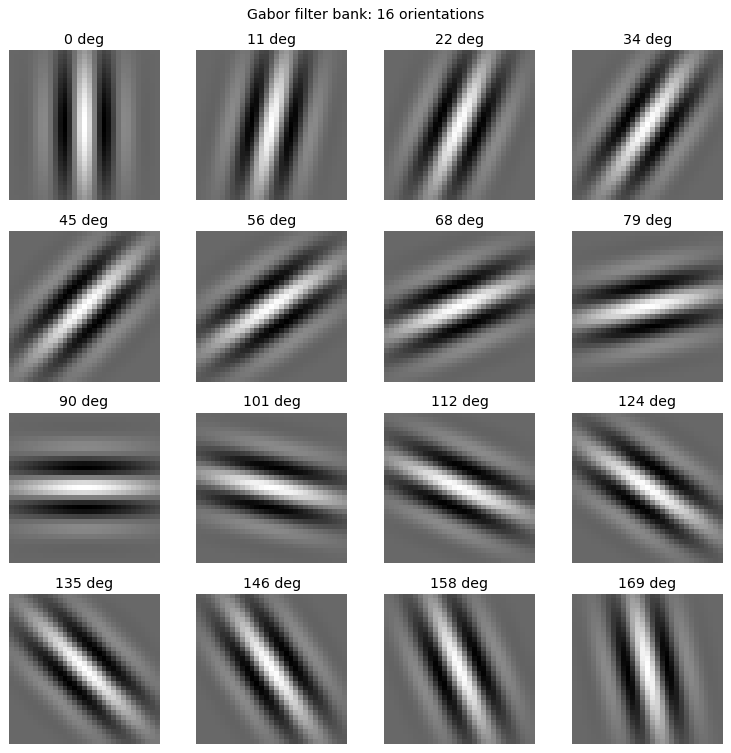
A bank of Gabor filters at evenly spaced orientations is a common choice. Below, sixteen filters spaced \(11.25^\circ\) apart are applied to a circle. Each filter responds most where the contour is tangent to its orientation, so the bright arc rotates around the circle as the orientation advances. The same bank applied to a natural texture gives a stack of orientation and scale specific responses.
def circle_img(n, r, w=1.3):
    yy, xx = np.mgrid[0:n, 0:n]
    d = np.sqrt((xx - n/2)**2 + (yy - n/2)**2)
    return (np.abs(d - r) < w).astype(float)

def gabor_magnitude(im, k):                    # magnitude of the complex Gabor response
    re = ndi.convolve(im, k.real, mode='reflect')
    od = ndi.convolve(im, k.imag, mode='reflect')
    return np.hypot(re, od)

thetas = np.linspace(0, np.pi, 16, endpoint=False)
bank = [gabor(31, 9, t) for t in thetas]
circ = circle_img(170, 60)

fig, ax = plt.subplots(4, 4, figsize=(9, 9))
for j, k in enumerate(bank):
    show(ax.flat[j], k.real, f'{np.rad2deg(thetas[j]):.0f} deg')
fig.suptitle('Gabor filter bank: 16 orientations'); plt.tight_layout(); plt.show()

fig, ax = plt.subplots(4, 4, figsize=(9, 9))
for j, k in enumerate(bank):
    show(ax.flat[j], gabor_magnitude(circ, k), f'{np.rad2deg(thetas[j]):.0f} deg', cmap='magma')
fig.suptitle('responses to a circle (orientation selectivity)'); plt.tight_layout(); plt.show()
# the same bank on a natural texture, one scale, four orientations
brick = load_gray(data.brick())[:256, :256]
fig, ax = plt.subplots(1, 5, figsize=(15, 3.4))
show(ax[0], brick, 'brick texture')
for j, deg in enumerate([0, 45, 90, 135]):
    k = gabor(21, 7, np.deg2rad(deg))
    show(ax[j + 1], gabor_magnitude(brick, k), f'response {deg} deg', cmap='magma')
plt.tight_layout(); plt.show()
8. Steerable filters#
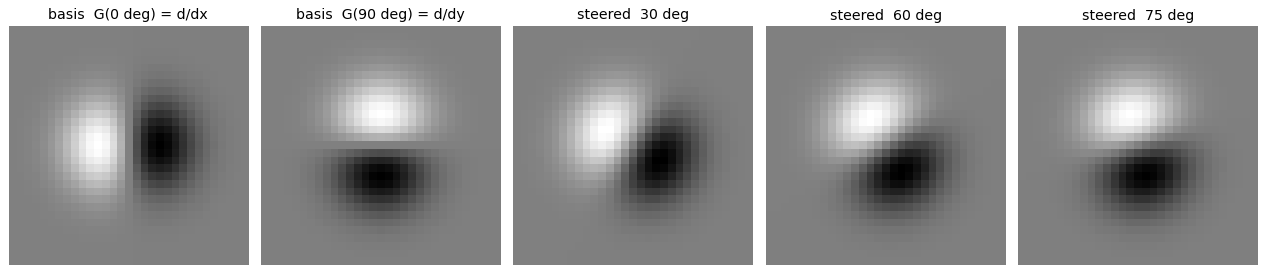
Applying a whole bank to recover every orientation is wasteful when the filters are related. A filter is steerable if an oriented copy at any angle is an exact linear combination of a small fixed set of basis filters.
The first derivative of a Gaussian is the simplest example. With the two basis filters
the derivative at any angle \(\theta\) is
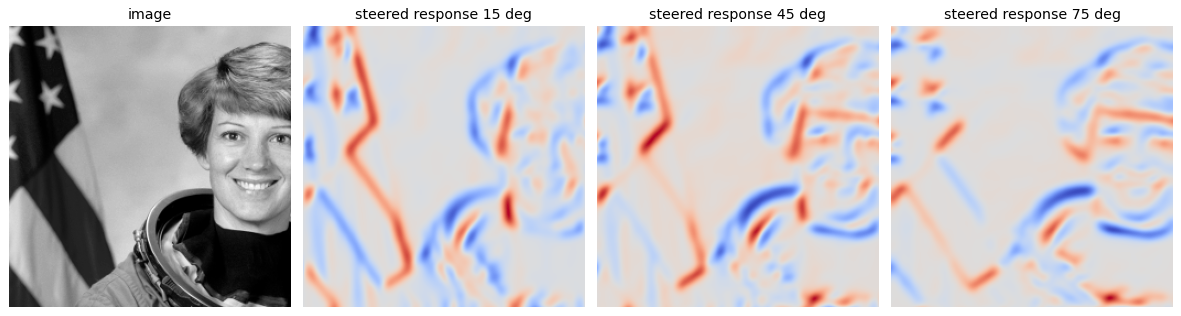
Because convolution is linear, the same holds for the responses. Filter the image once with each basis filter to get \(R_0\) and \(R_{90}\), then the response of the \(\theta\) oriented filter at every pixel is
with no further filtering. Two convolutions give every orientation.
def gauss_xy(size, sigma):
    r = size//2; y, x = np.mgrid[-r:r + 1, -r:r + 1]
    return x, y, np.exp(-(x**2 + y**2)/(2*sigma**2))

def dgauss_dir(size, sigma, theta):            # 1st derivative of Gaussian along theta
    x, y, g = gauss_xy(size, sigma)
    return -(x*np.cos(theta) + y*np.sin(theta))/sigma**2 * g

size, sigma = 31, 4
x, y, g = gauss_xy(size, sigma)
G0, G90 = -x/sigma**2 * g, -y/sigma**2 * g     # the two basis filters

# basis filters and a few steered kernels
fig, ax = plt.subplots(1, 5, figsize=(15, 3.4))
show(ax[0], G0,  'basis  G(0 deg) = d/dx')
show(ax[1], G90, 'basis  G(90 deg) = d/dy')
for j, deg in enumerate([30, 60, 75]):
    t = np.deg2rad(deg)
    show(ax[j + 2], np.cos(t)*G0 + np.sin(t)*G90, f'steered  {deg} deg')
plt.tight_layout(); plt.show()
# response synthesis: filter twice, steer the response to any angle for free
pic = load_gray(data.astronaut())[:256, :256]
R0  = ndi.convolve(pic, G0,  mode='reflect')
R90 = ndi.convolve(pic, G90, mode='reflect')

fig, ax = plt.subplots(1, 4, figsize=(14, 3.8))
show(ax[0], pic, 'image')
for j, deg in enumerate([15, 45, 75]):
    t = np.deg2rad(deg)
    synth = np.cos(t)*R0 + np.sin(t)*R90
    show(ax[j + 1], synth, f'steered response {deg} deg', cmap='coolwarm')
plt.tight_layout(); plt.show()

# the synthesized response matches direct filtering with the oriented kernel
err = max(np.abs((np.cos(np.deg2rad(d))*R0 + np.sin(np.deg2rad(d))*R90)
                 - ndi.convolve(pic, dgauss_dir(size, sigma, np.deg2rad(d)), mode='reflect')).max()
          for d in [15, 45, 75])
print('max |synthesized - directly filtered| over the three angles:', err)
.../site-packages/skimage/color/colorconv.py:984: RuntimeWarning: divide by zero encountered in matmul
  return rgb @ coeffs
.../site-packages/skimage/color/colorconv.py:984: RuntimeWarning: overflow encountered in matmul
  return rgb @ coeffs
.../site-packages/skimage/color/colorconv.py:984: RuntimeWarning: invalid value encountered in matmul
  return rgb @ coeffs
max |synthesized - directly filtered| over the three angles: 3.108624468950438e-14
9. Explore and verify#
The Laplacian pyramid claims to be exactly invertible, and the scale signature claims that a disk of radius \(r\) peaks at \(\sigma^\star \approx r/\sqrt{2}\). Both are precise enough to check numerically, so we do.
# Verify the scale-space claims.
import scipy.ndimage as ndi

im = load_gray(data.camera())

# 1. The Laplacian pyramid reconstructs the original, to machine precision.
lap = laplacian_pyramid(im, 4)
rec = reconstruct(lap)
err = np.abs(rec - im).max()
assert err < 1e-9, f'Laplacian pyramid is not invertible: max error {err:.2e}'

# 2. A disk of radius r peaks at sigma ~ r/sqrt(2) in the scale-normalized LoG.
sigmas = np.linspace(2, 30, 60)
for r in (6, 10, 16):
    d = disk(160, 80, 80, r)
    resp = [np.abs(norm_log(d, s))[80, 80] for s in sigmas]
    peak = sigmas[int(np.argmax(resp))]
    predicted = r / np.sqrt(2)
    assert abs(peak - predicted) / predicted < 0.35, f'r={r}: peak {peak:.1f} vs predicted {predicted:.1f}'
    print(f'  radius {r:2d}:  peak at sigma = {peak:5.2f}   predicted r/sqrt(2) = {predicted:5.2f}')

print(f'\nLaplacian pyramid reconstruction, max |error| = {err:.2e}')
  radius  6:  peak at sigma =  4.37   predicted r/sqrt(2) =  4.24
  radius 10:  peak at sigma =  7.22   predicted r/sqrt(2) =  7.07
  radius 16:  peak at sigma = 11.49   predicted r/sqrt(2) = 11.31

Laplacian pyramid reconstruction, max |error| = 1.11e-16
# Static sweep: a Gabor filter bank across orientation. gabor() is complex, so take .real.
import scipy.ndimage as ndi
tex = load_gray(data.brick())

fig, ax = plt.subplots(2, 5, figsize=(15, 6))
for j, th in enumerate([0, 36, 72, 108, 144]):
    g = gabor(31, lam=8, theta=np.deg2rad(th)).real
    ax[0, j].imshow(g, cmap='RdBu_r'); ax[0, j].set_axis_off()
    ax[0, j].set_title(f'$\theta$ = {th}°', fontsize=10)
    ax[1, j].imshow(ndi.convolve(tex, g, mode='reflect'), cmap='gray'); ax[1, j].set_axis_off()
fig.suptitle('A Gabor bank: each orientation answers a different question of the texture', y=1.0)
plt.tight_layout(); plt.show()
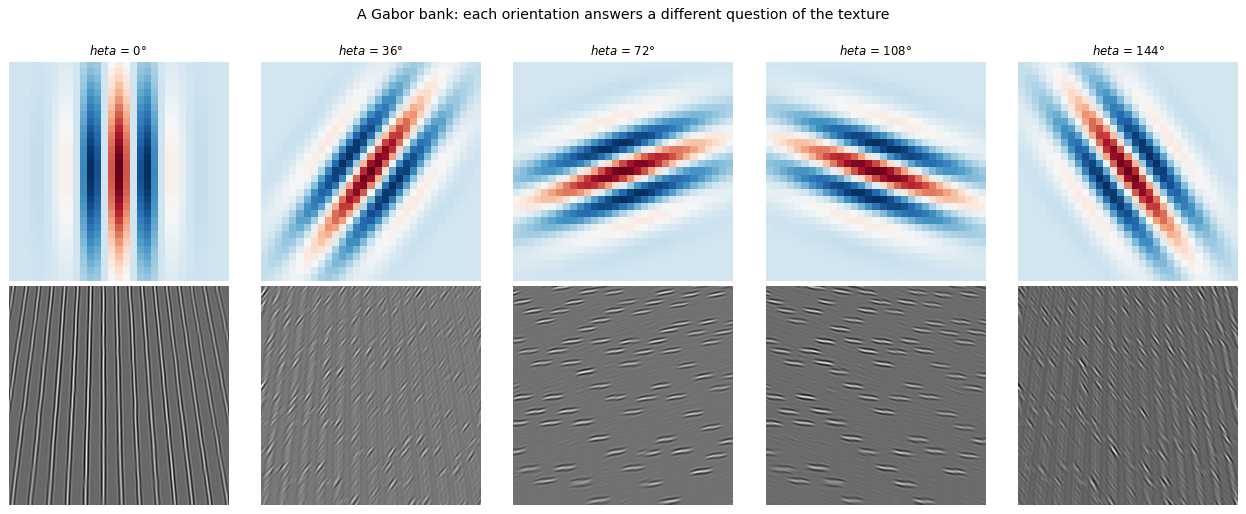
Now the same thing under your control. Drag the slider and watch what changes.
# Live: orientation and wavelength of a Gabor filter.
from ipywidgets import interact, IntSlider

def gab(theta_deg=0, lam=8):
    g = gabor(31, lam=lam, theta=np.deg2rad(theta_deg)).real
    r = ndi.convolve(tex, g, mode='reflect')
    fig, ax = plt.subplots(1, 2, figsize=(9, 4.4))
    ax[0].imshow(g, cmap='RdBu_r'); ax[0].set_title(f'Gabor: $\theta$={theta_deg}°, $\lambda$={lam}')
    ax[1].imshow(r, cmap='gray');   ax[1].set_title('response on brick texture')
    for a in ax: a.set_axis_off()
    plt.tight_layout(); plt.show()

interact(gab, theta_deg=IntSlider(min=0, max=170, step=10, value=0),
              lam=IntSlider(min=3, max=20, step=1, value=8));
Key takeaways#
Concept |
Key takeaway |
|---|---|
Characteristic scale |
Peak of the scale-normalized LoG over \(\sigma\); for a disk of radius \(r\) it sits at \(\sigma^\star = r/\sqrt 2\) |
Scale signature |
Response vs scale at a point; doubling the structure size doubles \(\sigma^\star\) |
Gaussian pyramid |
Smooth then downsample by two; smoothing first prevents aliasing |
Laplacian pyramid |
\(L_k = G_k - \mathrm{expand}(G_{k+1})\); band-pass and exactly invertible |
Coarse-to-fine |
Estimate displacement at the coarse scale, refine downward; a tiny search at every level |
Texture |
Spatial layout, not the histogram; oriented filter responses separate patterns with equal histograms |
Filter bank |
Band-pass filters over orientation and scale; keep the response magnitudes |
Gabor filter |
Sinusoid times a Gaussian; tuned to one frequency and orientation |
Steerable filter |
The oriented filter at any angle is a fixed linear combination of a few basis filters |
Reading: Szeliski, Computer Vision: Algorithms and Applications, Ch. 2.
To think about: Why is camouflage effective, and how? How is texture different from noise? Will scale-invariant filters help match pictures of nested Matryoshka dolls?
Exercises#
The signature tracks size. Compute the scale signature at a point, then double the size of the structure and confirm the peak \(\sigma^\star\) doubles.
Laplacian pyramid is invertible. Build \(L_k = G_k - \mathrm{expand}(G_{k+1})\), reconstruct the original, and confirm the error is at machine precision. What breaks if you skip the smoothing before downsampling?
Coarse-to-fine registration. Shift an image by a known offset, then recover it using a small search at each pyramid level. Compare the work done against a single full-resolution search.
Texture needs layout. Build two images with identical intensity histograms but different texture, and show a histogram cannot separate them while a Gabor filter bank can.